-
[WPF] LiveCharts.WPF를 이용한 차트 그리기 (In xaml / In code)Microsoft .NET/WPF 2020. 1. 7. 18:07WPF_Chart.zip1.89MB

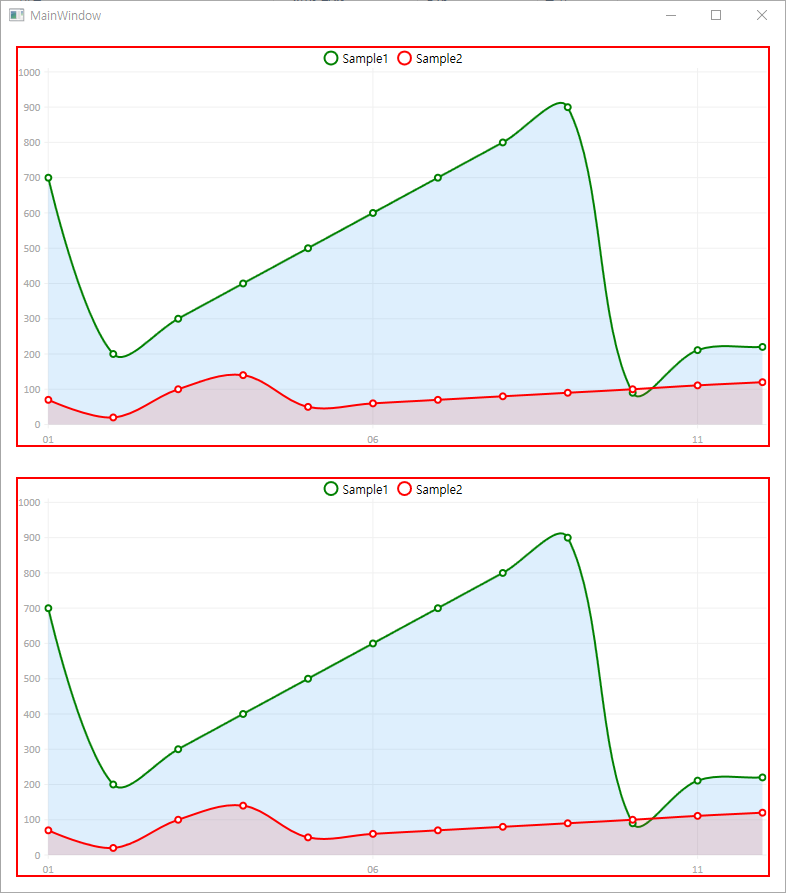
위 - Code에서 작성된 차트 아래 - Xaml에서 작성된 차트 NuGet : LiveCharts.Wpf
Xaml
<Window x:Class="WPF_Chart.MainWindow"
        xmlns="http://schemas.microsoft.com/winfx/2006/xaml/presentation"
        xmlns:x="http://schemas.microsoft.com/winfx/2006/xaml"
        xmlns:d="http://schemas.microsoft.com/expression/blend/2008"
        xmlns:mc="http://schemas.openxmlformats.org/markup-compatibility/2006"
        xmlns:local="clr-namespace:WPF_Chart"
        xmlns:live="clr-namespace:LiveCharts.Wpf;assembly=LiveCharts.Wpf"
        mc:Ignorable="d"
        Title="MainWindow" Height="900" Width="800">
    <Grid>
        <Grid.RowDefinitions>
            <RowDefinition Height="1*"/>
            <RowDefinition Height="1*"/>
        </Grid.RowDefinitions>

        <!--In Code-->
        <live:CartesianChart
            x:Name="chart"
            BorderBrush="Red" BorderThickness="2"
            LegendLocation="Top"
            Margin="15"/>

        <!--In Xaml-->
        <live:CartesianChart
            Grid.Row="1"
            BorderBrush="Red" BorderThickness="2"
            LegendLocation="Top"
            Margin="15">
            <live:CartesianChart.AxisY>
                <live:Axis MinValue="0" MaxValue="1000"/>
            </live:CartesianChart.AxisY>
            <live:CartesianChart.AxisX>
                <live:Axis Labels="01, 02, 03, 04, 05, 06, 07, 08, 09, 10, 11, 12"/>
            </live:CartesianChart.AxisX>
            <live:CartesianChart.Series>
                <live:LineSeries Stroke="Green" Title="Sample1" Values="700, 200, 300, 400, 500, 600, 700, 800, 900, 90, 211, 220"/>
                <live:LineSeries Stroke="Red" Title="Sample2" Values=" 70, 20, 100, 140, 50, 60, 70, 80, 90, 100, 111, 120"/>
            </live:CartesianChart.Series>
        </live:CartesianChart>
    </Grid>
</Window>
Code
using System.Collections.Generic; using System.Windows; using System.Windows.Media; namespace WPF_Chart { /// <summary> /// MainWindow.xaml에 대한 상호 작용 논리 /// </summary> public partial class MainWindow : Window { public MainWindow() { InitializeComponent(); //범례 위치 설정 chart.LegendLocation = LiveCharts.LegendLocation.Top; //세로 눈금 값 설정 chart.AxisY.Add(new LiveCharts.Wpf.Axis { MinValue=0, MaxValue = 1000 }); //가로 눈금 값 설정 chart.AxisX.Add(new LiveCharts.Wpf.Axis { Labels = new string[] { "01", "02", "03", "04", "05", "06", "07", "08", "09", "10", "11", "12"} }); //모든 항목 지우기 chart.Series.Clear(); //항목 추가 chart.Series.Add(new LiveCharts.Wpf.LineSeries() { Title = "Sample1", Stroke = new SolidColorBrush(Colors.Green), Values = new LiveCharts.ChartValues<double>(new List<double> { 700, 200, 300, 400, 500, 600, 700, 800, 900, 90, 211, 220 }) } ); chart.Series.Add(new LiveCharts.Wpf.LineSeries() { Title = "Sample2", Stroke = new SolidColorBrush(Colors.Red), Values = new LiveCharts.ChartValues<double>(new List<double> { 70, 20, 100, 140, 50, 60, 70, 80, 90, 100, 111, 120 }) } ); } } }'Microsoft .NET > WPF' 카테고리의 다른 글
[WPF] hexColor to (Color or SolidColorBrush) (0) 2021.11.24 [WPF] 지역화 (다중 언어) (0) 2020.12.07 [WPF] '_' 문자가 출력되지 않는 경우! (Underline, Underscore) (0) 2019.07.03 [WPF] Timer ( DispatcherTimer ) (0) 2019.07.03 [WPF] ListView (0) 2019.05.13